Dashboard
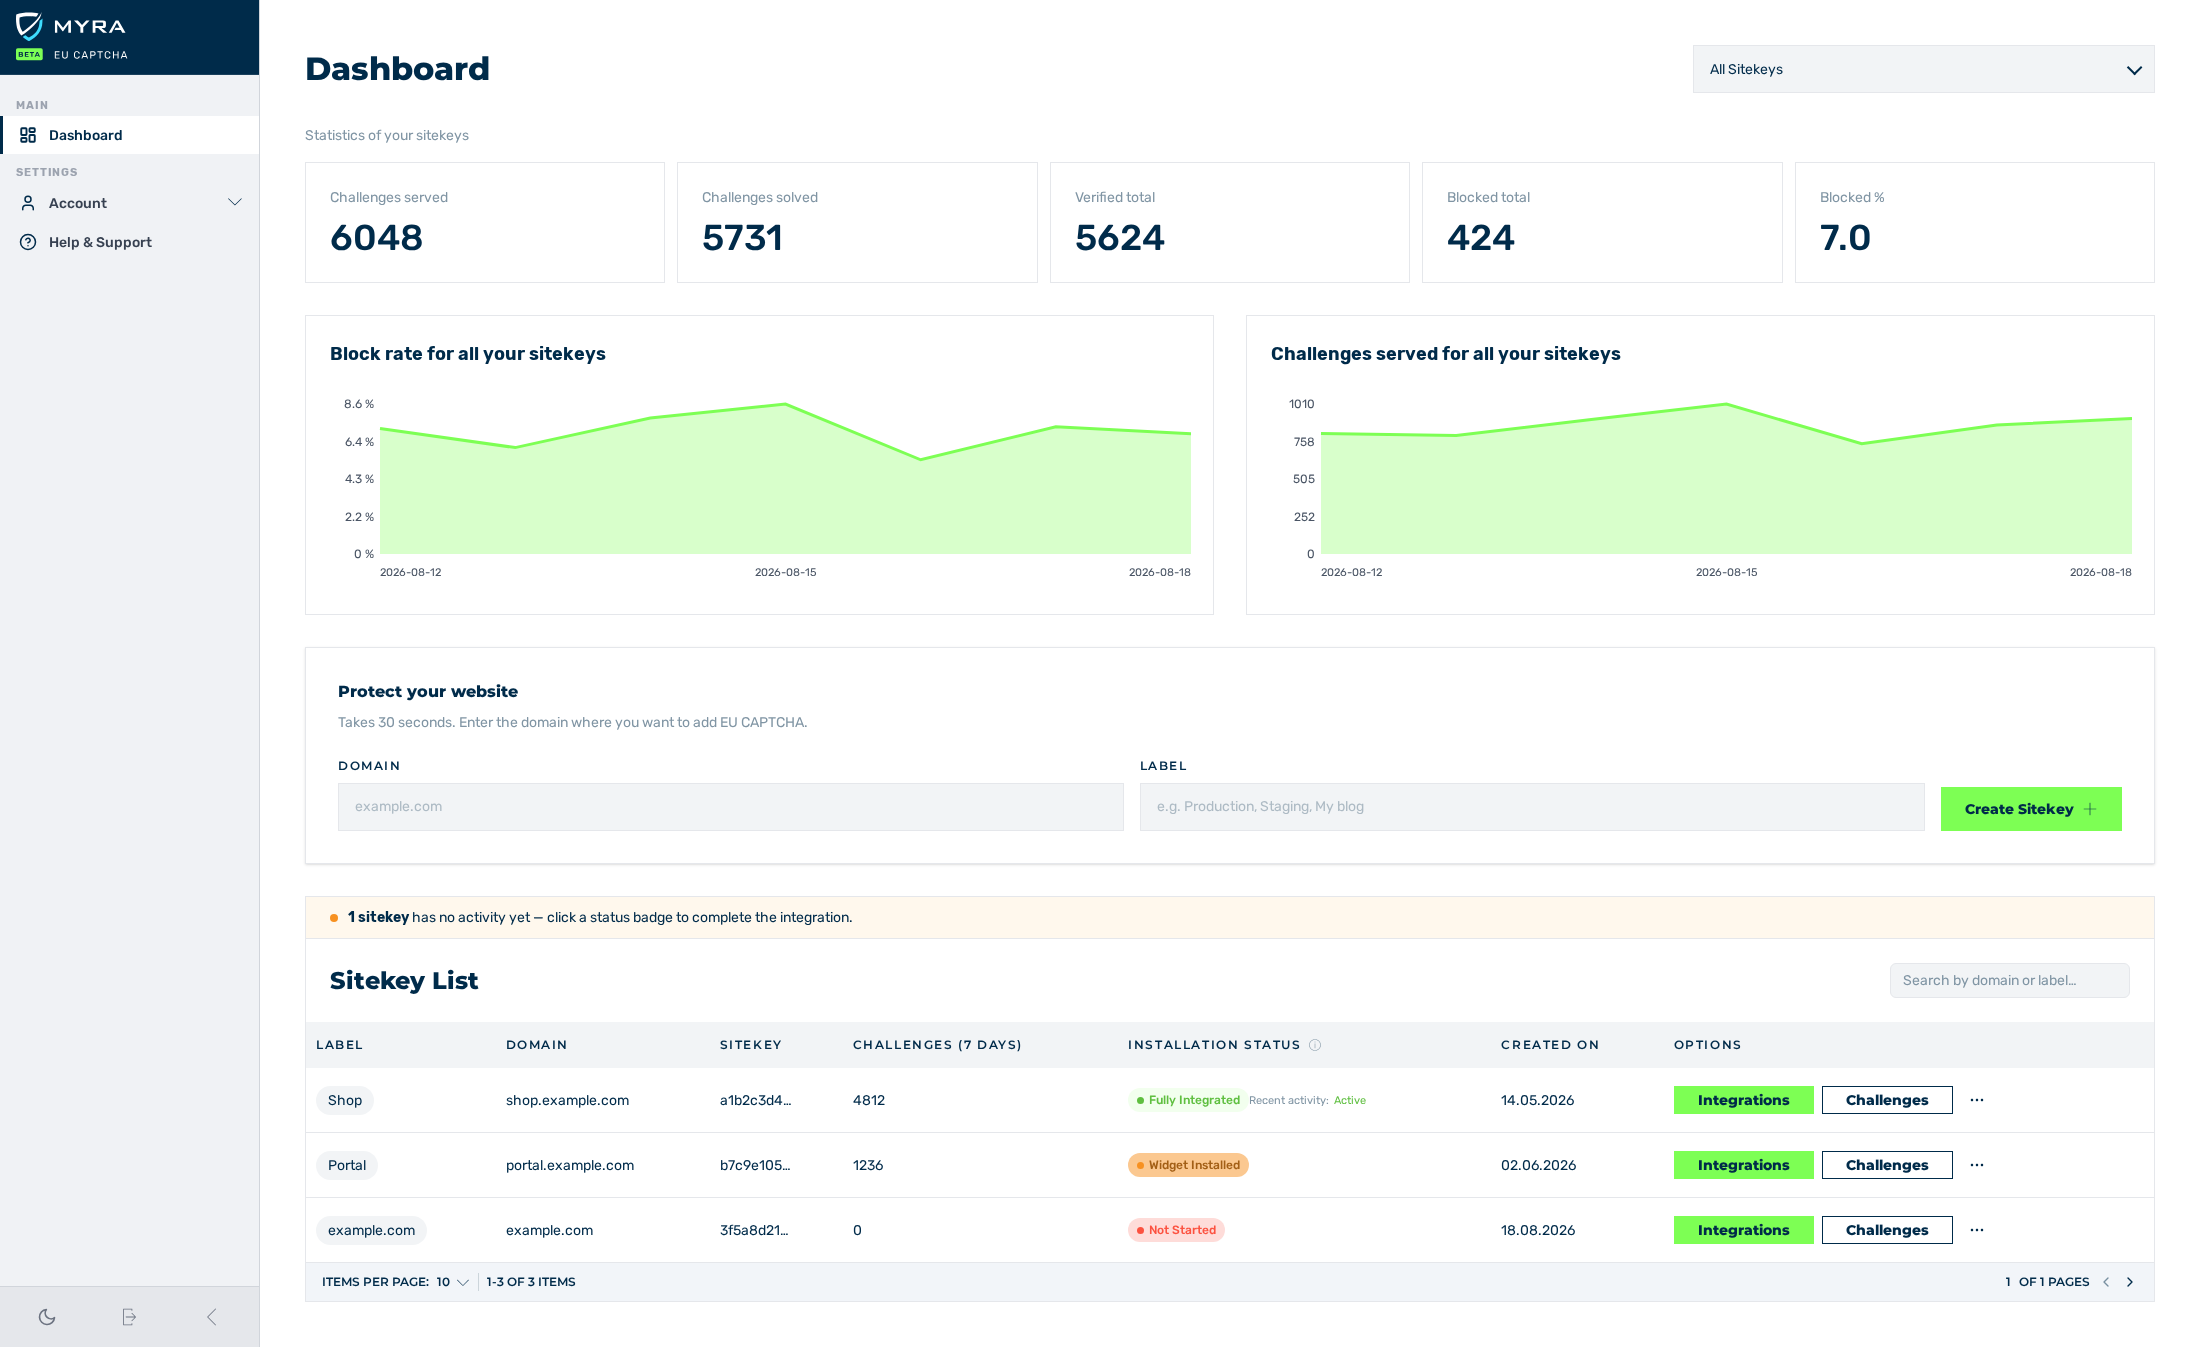
Dashboard view
The Dashboard view is the start view of the customer portal. It shows the key figures and the trend of the challenges. Below them, the view shows the list of the sitekeys.
The Dashboard view and its metrics
Selection of the sitekeys
Above the row of the key figures, a drop-down list with the sitekeys is shown. The All Sitekeys entry collects all sitekeys. If you select one sitekey, the key figures and the graphs refer only to this sitekey.
A search field limits the list. A button resets the search.
Key figures
The Statistics of your sitekeys row contains these key figures:
| Key figure | Meaning |
|---|---|
| Challenges served | Count of the supplied challenges |
| Challenges solved | Count of the solved challenges |
| Verified total | Count of the tokens that were confirmed on the server |
| Blocked total | Count of the blocked requests |
| Blocked % | Part of the blocked requests in all challenges |
Graphs
Two trend graphs appear below the key figures:
| Graph | Contents |
|---|---|
| Block rate for … | Trend of the block rate |
| Challenges served for … | Trend of the supplied challenges |
The title names the label of the selected sitekey. If you selected the All Sitekeys entry, all your sitekeys is shown there.
While no data is available, the graph shows the No data yet. Data appears within minutes of your first verified CAPTCHA challenge. note.
Notes for the start
Depending on the state of the setup, the dashboard shows one of these notes:
| Note | Meaning | Button |
|---|---|---|
| Protect your first website | No sitekey is available yet. | Add your first domain |
| Complete your integration | A sitekey is available, but no challenge was supplied yet. | Go to integration guide |
After you create a sitekey, the Sitekey created message is also shown.
List of the sitekeys
The list of the sitekeys is shown below the graphs. See Sitekey List area.